A technique to provide isolation and performance guarantees to applications sharing memory resources on server-like platforms.
About

Our research for phase detection in applications focuses on an end-to-end solution that is usable by the broad general-purpose community for applications on server-like machines. We aim to detect phases to provide better temporal isolation to the applications sharing resources at the different levels of the memory hierarchy by using available hardware management tools.
The work can be divided into three main steps:
- Profiling the application to gather relevant information of the behavior. The requirements of a profiler have been discussed in a previous publication. The components of the new profiler will be discussed in the following publication.
- Classifying the application into different phases based on the gathered data. We rely on widely available and maintained tools for gathering profiling data to make our approach adaptable across platforms.
- Automatically re-adjusting the resources, such as cache ways, and memory bandwidth, over the different phases. We have explored the tools needed for doing so on Intel platforms in a previous work.
Motivation
Our research aims to use phase detection to improve application performance while achieving high determinism by managing shared resources at the memory hierarchy.
As a system runs multiple applications concurrently, it puts pressure on the shared resources and leads to a lack of temporal isolation.
By statically managing the available hardware resources, such as scaling the voltage and frequency of the processor (DVFS), number of cores, etc., and restricting the usage of the resource below its saturation level, we hope to limit interference to enable deterministic performance for performance-sensitive applications.
Also, the utilization of the shared resources on a system can be further improved if the management occurs dynamically as the application transitions through different phases. For example, if the application is in a cache-sensitive phase, limiting the main memory bandwidth will not impact the application’s performance. Thus, the bandwidth can be utilized by another application running on the same system.

Preliminary Results
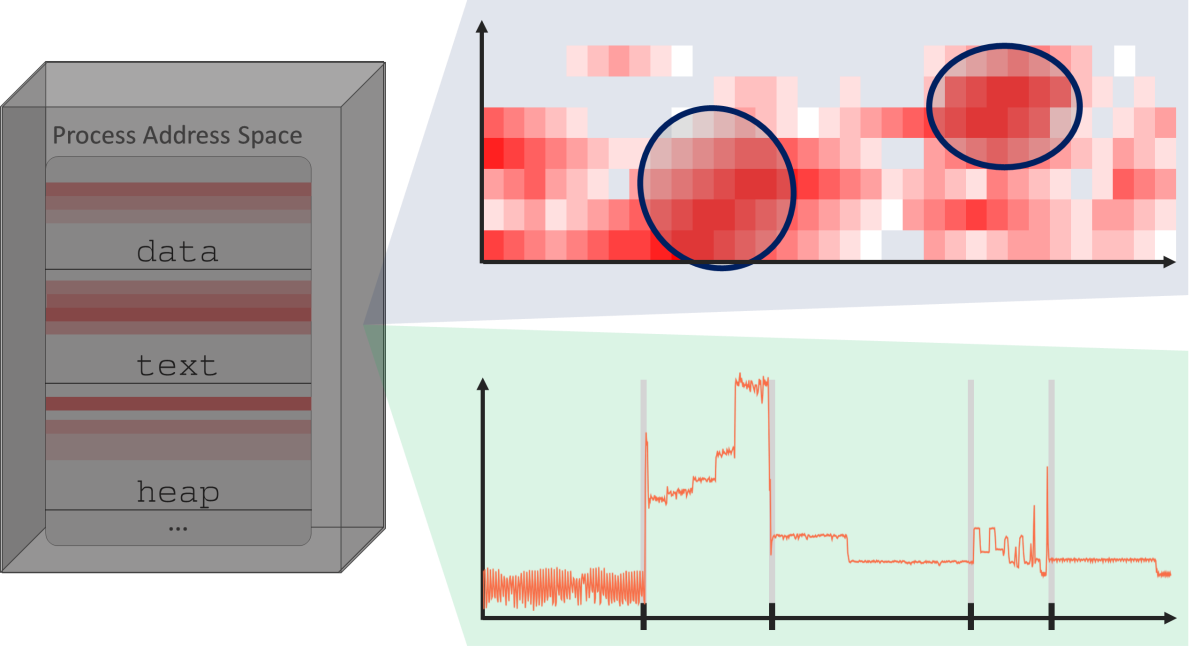
Previous research works have shown that many application execute various code segments with changing requirements. For example, the application might transition from waiting for an I/O request to be completed to performing main memory transactions. These changes in the application behavior are called phases, and each phase exhibits a different characteristic or resource requirement. Often, these phases are not a one-time occurrence but are observed repeatedly throughout an application’s runtime. Much effort into analyzing the repetitive application behavior has been conducted to understand the varying resource requirements of the applications better. Over the course of this research work we not only aim to provide temporal isolation but attempt to provide a more standard definition of what an application phase is.


Preliminary results with Disparity ( from The San Diego Vision Benchmark Suite) show repetitive behavior in cache misses. The slopes correspond to the rate of cache misses.
Test Platform Details

Intel seeing the need for resource management at monitoring of the shared resources has deployed some solutions under the name of RDT.
RDT is made up of five mechanisms that can be subdivided into resource allocation and resource monitoring capabilities :
- Cache Allocation Technology (CAT),
- Code and Data Prioritiza- tion (CDP),
- Cache Monitoring Technology (CMT),
- Memory Bandwidth Allocation (MBA), and
- Memory Bandwidth Monitoring (MBM).
CAT and MBA help manage the shared cache and main memory bandwidth, respectively. CDP is an extension of CAT which enables the user to select the placement of code and data in the shared cache. CMT and MBM monitor the shared cache and main memory bandwidth. RDT was first introduced in Intel Xeon E5 v3 family of processors with limited functionality . Our paper uses two different generations of Intel platforms: 1) 2nd Generation Xeon Scalable Processors (Cascade Lake), and 2) 3rd Generation Xeon Scalable Processors (Ice Lake).
The mechanisms highlighted in the figure on the right are discussed in our paper. Furthermore, these mechanisms will be used in our research to achieve the goal of profiling and resource management.
Milestones
June, 2022
Publication
Understanding the hardware resource mangement tools on our hardware.
Sep, 2022
Code Milestone
Memory profiler based on widely available hardware counters.
Nov, 2022
Code Milestone
Low overhead kernel module to understand function level distinctions in an application.